To access Credentials Dashboard, select Reporting> Credential Reporting > Credentials Dashboard.
In Credential Reporting, you will find two tabs: the "Reports" tab, which lists all available reporting options, and the "Executed Reports" tab, where you can access downloadable reports that have been previously generated.
The Credentials Dashboard will launch, loading data from the organization credentialing activity (example below has sample data for illustrative purposes):
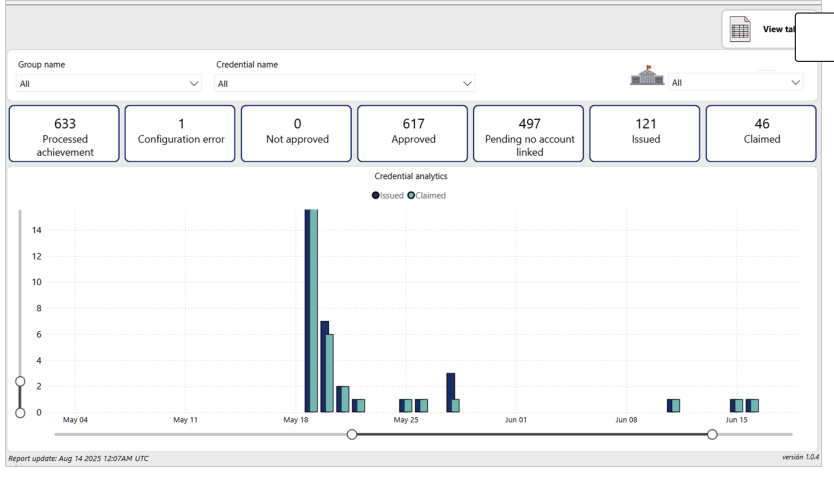
There are many filters to display the data relevant to your organization (which is selected by default in the Institutions drop-down field).
- Group Name - This field refers to collections of learners that have been assigned to specific activities in the platform
- Credential Name - This field refers to the different awards created and issued in the platform

The main Metrics in the data are contained within the buttons above the graph including
- Processed Achievement
- Configuration Error
- Not Approved
- Approved
- Pending no account linked (This metric indicates the number of learners that have a pending credential, but no account has been created)
- Issued
- Claimed
Dataset investigation tools around the graph include:
- View Table/View Graph toggle to the right of the Filters - this tool lets you see the individual student credential data that is shown in the graph including the student name and dates issued/claimed
- Status - The status options are Approved, Claimed, Configuration error, Issued, Not approved, Pending no account linked, and Processed

- In the graph view, the slide bar along bottom of the graph is used to zoom out/in time
- In the graph view, the slide bar along left of the graph is used to limit/increase the scale of data shown
- To export/download your report use the View table toggle to show your table. Then hover in the upper right corner of your table to get the More options buttons. The first option is the Export data.

From the Export data dialog box, select the format options and click Export.
