
There are two test forms available: Standard and Abbreviated. Both forms are statistically equated assessments and offer the same level of score detail at the group level.
The Standard form provides:
- a total score, subscores, and proficiency classifications for individual students
- total scores, norm-referenced subscores, and criterion-referenced scores at the group level
- an alphabetical roster with individual student scores
The Abbreviated form is statistically equated to the Standard form and provides:
- a total score, but no subscores, for individual students
- total scores, norm-referenced subscores, and criterion-referenced scores at the group level. Thirty valid results are necessary to generate aggregate reports.
The E-Proficiency Profile has two scoring conventions: Norm-referenced scores (scaled scores) and criterion-referenced scores (proficiency classifications).
Report Access
LifeJourney is the source for all reports. Institutions will find reports in the Administrations Dashboard under Assessments.
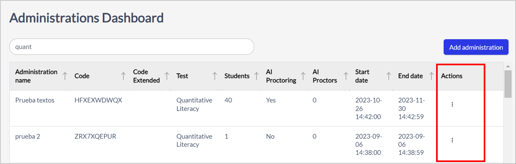
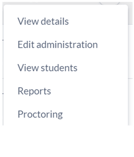
Identify the Administration and under the Actions column 3 button menu click on the Reports option.
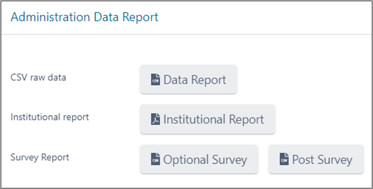
The Administration Data Reports available are dependent on how the Administration was setup and configured. Click on a report to download.
Institutional Score Report
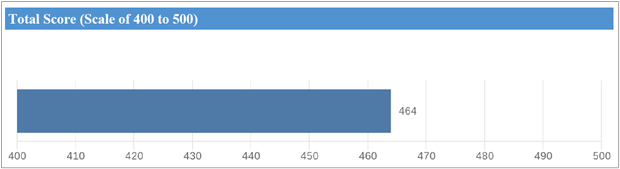
The institutional score report contains information about the distribution of students’ scaled scores within the Reporting Group.
- Summary of Scaled Scores, Distribution of Scores, Total Scores (mean scaled score, standard deviation, confidence interval, percentiles)

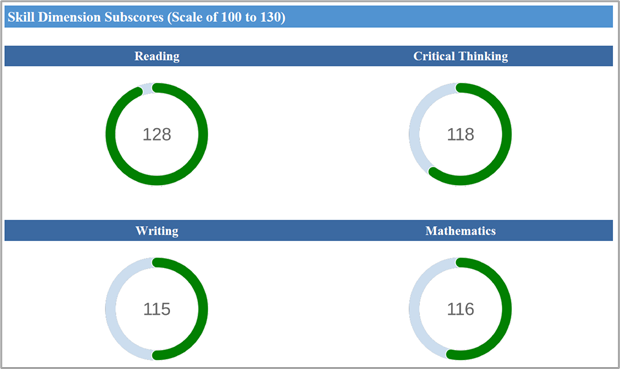
- Skill Dimension Subscores, Distribution of Scores, Total Scores (mean scaled score, standard deviation, confidence interval, percentiles)

- Summary of Proficiency Classification
Individuals taking the E-Proficiency Profile are asked to demonstrate a wide variety of abilities across four skills, these skills are further categorized by levels of difficulty. Based on a score range, three performance levels can be earned. Performance Levels.

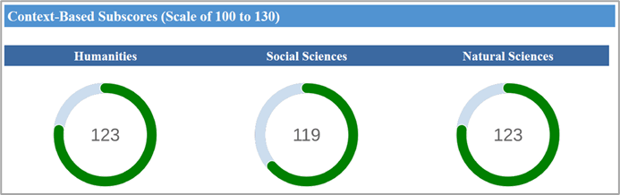
- Context Bases Subscores, Distribution of Scores, Total Scores (mean scaled score, standard deviation, confidence interval, percentiles)

Data Report
Individual student complete score information.
| Assessment administration | PPC Humanities |
| Started date & time | PPC Social Sciences |
| Finished date & time | PPC Natural Sciences |
| Extended time | Total score |
| Learner name | PPS Reading & Critical Thinking 1 |
| Learner last name | PPS Reading & Critical Thinking 2 |
| Learner ID | PPS Reading & Critical Thinking 3 |
| Learner email | PPS Writing 1 |
| Percent of questions answered | PPS Writing 2 |
| PPS Reading | PPS Writing 3 |
| PPS Critical Thinking | PPS Mathematics 1 |
| PPS Writing | PPS Mathematics 2 |
| PPS Mathematics | PPS Mathematics 3 |
PPC = Proficiency Profile Content
PPS = Proficiency Profile Skill
Survey Reports - Optional & Post
Optional Survey CSV - student responses to the optional questions asked prior to the test.
Post Survey CSV - student responses to the optional custom questions asked at the completion of the test.
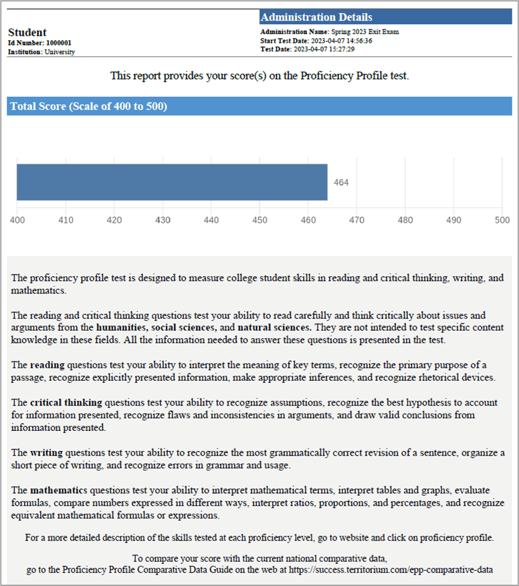
Learner Score Report
The learner score report is available to institutions and students (if institution selected "Show scores to students") and the format will vary based on the assessment form administered (standard or abbreviated).
- Standard report elements: Total Score, Tested Skill Descriptions, Skill Dimension Subscores, Proficiency Classifications, and Context-Based Subscores
- Abbreviated report elements: Total Score, and Tested Skill Descriptions
Recently asked questions....